Vehicle Details Reporting
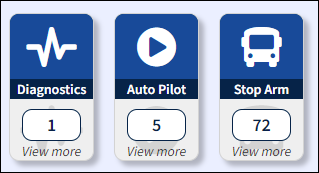
Diagnostics information, Auto Pilot, and Stop Arm events can be accessed by clicking the Show Details button ![]() on the lower right corner of the window. An array of three buttons appear that when clicked, display detail reports for the specified category. The number of occurrences for each is denoted on the button.
on the lower right corner of the window. An array of three buttons appear that when clicked, display detail reports for the specified category. The number of occurrences for each is denoted on the button.

Detail Report Buttons
Diagnostics Details
The level of severity, a brief description of diagnostic events with the date and time of the last occurrence of the event is listed on a table. The Count column lists the number of occurrences. Click the 'x' button to dismiss the event.

Diagnostics Details Table
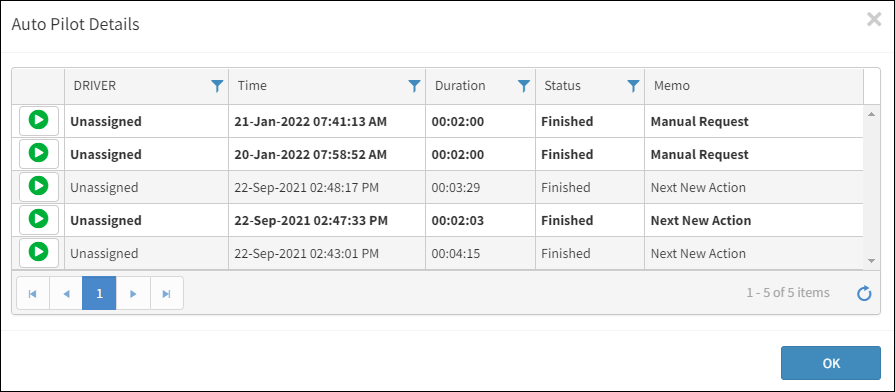
Auto Pilot Details
A list of available event videos listed on a table with the driver, date and time of the video, the duration of the video, status of the video being downloaded, and a memo describing the details of the video. Click on the play video button![]() to open the Video Playback window for the selected video. The columns containing the
to open the Video Playback window for the selected video. The columns containing the ![]() icon have the capability to allow filtering for a closer review of a specific event or to examine a more narrow category of vehicle details.
icon have the capability to allow filtering for a closer review of a specific event or to examine a more narrow category of vehicle details.

Auto Pilot Details Table
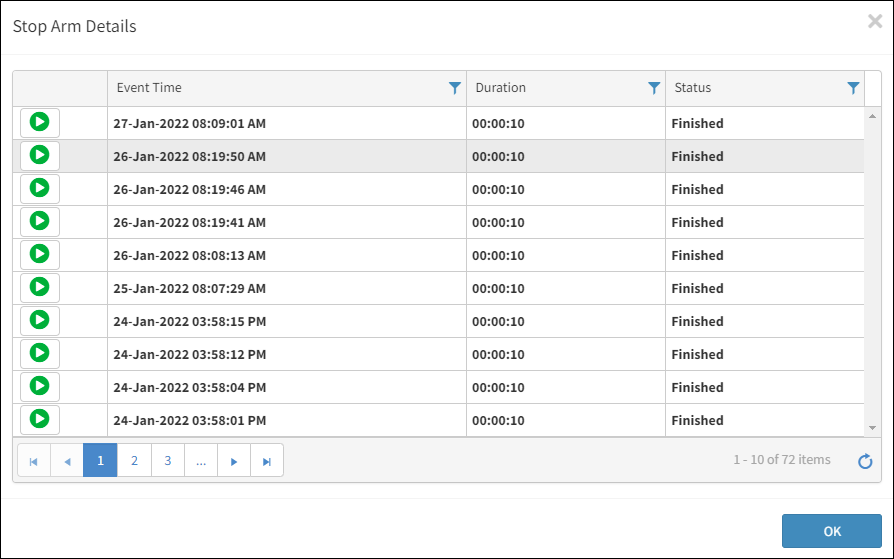
Stop Arm Details
Lists the event time, duration, and status of the video. The columns containing the ![]() icon have the capability to allow filtering for a closer review of a specific event or to examine a more narrow category of vehicle details. Click on the play video button
icon have the capability to allow filtering for a closer review of a specific event or to examine a more narrow category of vehicle details. Click on the play video button![]() to open the Video Playback window for the selected video.
to open the Video Playback window for the selected video.

Stop Arm Details Table
Refer to the Sorting and Filtering section in the Introduction for information about using filters.
Click the Graphs button to revert to the initial view displaying the graphs.
