Bandwidth Usage
Use the following table for tracking and logging of bandwidth usage. The risk of bandwidth overages incurred during metadata downloading, video downloading, and watching live video can be reduced by monitoring where bandwidth resources are directed. Monitoring bandwidth usage can help avoid the expense caused from data plan overages.
The amount of data used listed on the Bandwidth Usage Table is an estimate and it is recommended that users consult with their cellular providers to acquire exact bandwidth usage data.

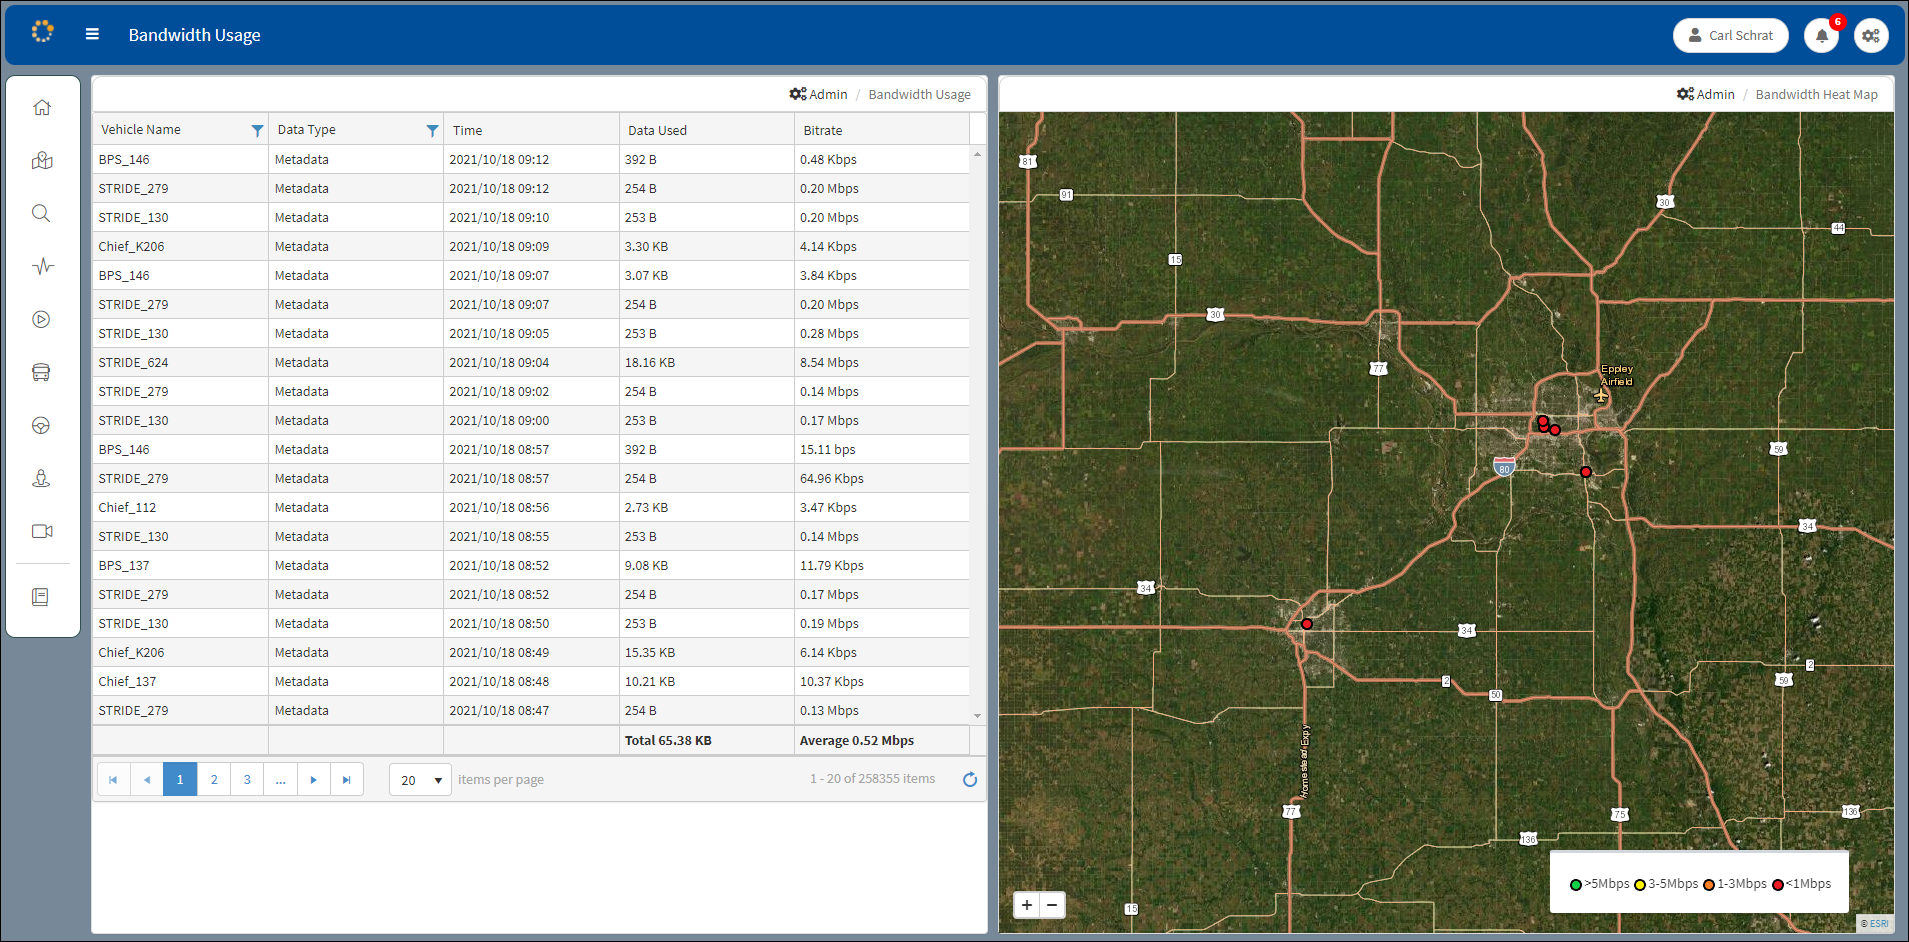
Bandwidth Usage Window Initial View
Bandwidth Map
A map is displayed on the right side of the window. The map identifies slow and fast download areas. The view can be expanded and contracted using the Zoom in/out ![]() buttons. The scale at the bottom of the map defines the speed ranges of the downloads identified by colored dots on the map. A green dot denotes download speed of 5 Mbps or higher. A yellow dot denotes a speed range of 3-5 Mbps. An orange dot denotes a download speed range of 1-3 Mbps, and red indicates a range of 1 or less Mbps.
buttons. The scale at the bottom of the map defines the speed ranges of the downloads identified by colored dots on the map. A green dot denotes download speed of 5 Mbps or higher. A yellow dot denotes a speed range of 3-5 Mbps. An orange dot denotes a download speed range of 1-3 Mbps, and red indicates a range of 1 or less Mbps.

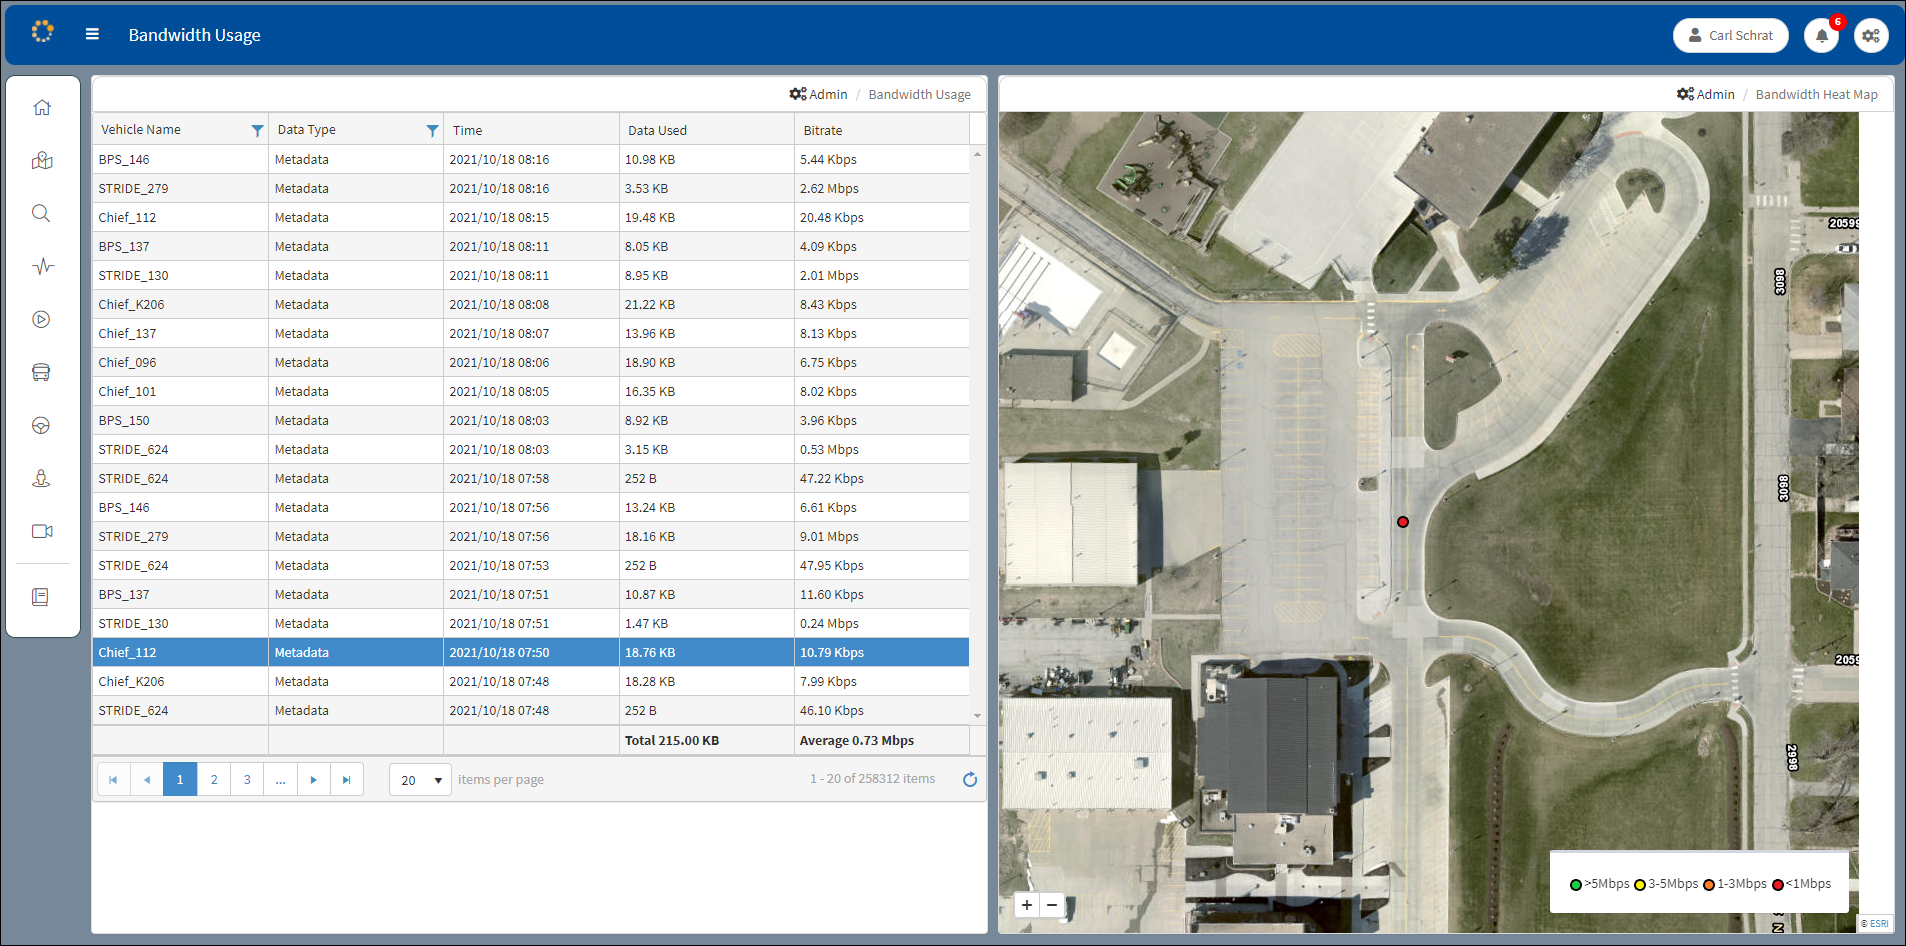
Bandwidth Map Display
When a dot on the map is clicked, the vehicle name associated with the dot is highlighted on the table to the left of the map.
Vehicle Name: Vehicle subject of the bandwidth usage.

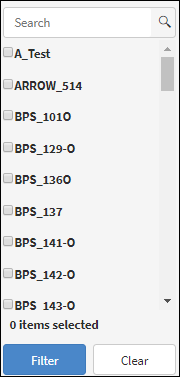
Vehicle Name Filter
Data Type: The type of download (Live streaming, metadata, or video) that is counting towards bandwidth usage.

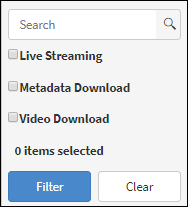
Data Type Filter
Time: Date and time when the bandwidth usage occurred.
Data Used: Amount of bandwidth, measured in kilobytes, consumed during the time when video is being watched in the Live application or when metadata/video is being downloaded.
Bitrate: The number of bits of information processed during recording on the subject vehicle that day.
All entries on the table can be sorted by clicking in the column and filtered by clicking the ![]() icon. Refer to the Sorting and Filtering section in the Introduction for information about using filters.
icon. Refer to the Sorting and Filtering section in the Introduction for information about using filters.
Use the arrow buttons on the tool bar in the lower left corner to page through the table.
Page Tool Bar
