Search
Click the Vehicle Logs button ![]() in the upper-right corner of the Diagnostics window to open the Diagnostics Search window to search for alerts by Group, Vehicle, and Start/End Date. Click "Diagnostics" next to the check box in the upper right corner of the window to return to the previous window.
in the upper-right corner of the Diagnostics window to open the Diagnostics Search window to search for alerts by Group, Vehicle, and Start/End Date. Click "Diagnostics" next to the check box in the upper right corner of the window to return to the previous window.

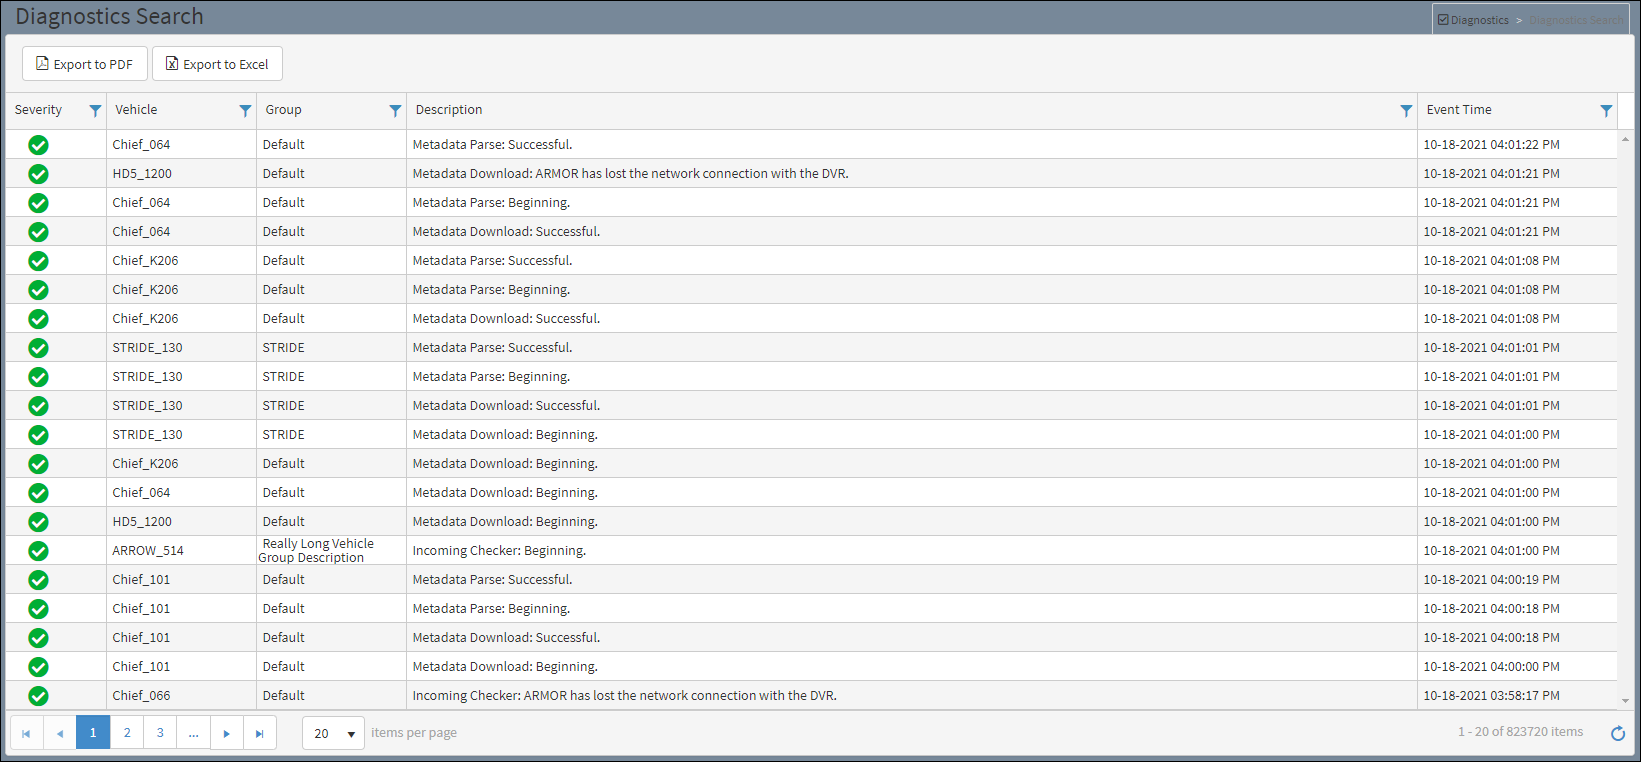
Diagnostics Search Window
Full Vehicle Log columns
Severity – Level of magnitude the event projects. Can be filtered to include one or a combination of the three levels of severity applied to the vehicle or vehicle group. Refer to the Filtering section for additional information.
![]() Informational – No equipment problems found on the vehicle.
Informational – No equipment problems found on the vehicle.
![]() Warning – Caution and/or attention is needed for equipment triggering this alert.
Warning – Caution and/or attention is needed for equipment triggering this alert.
![]() Severe – Requires immediate attention due to system failure or corrupt equipment.
Severe – Requires immediate attention due to system failure or corrupt equipment.
Vehicle – The vehicle subject of the review.
Group – Displays the group that the vehicle is assigned (i.e. Bellevue).
Description – Event or issue of magnitude pertaining to the subject vehicle. If a Panic! Alert message pops up on the window, it will also be noted in the Description column.

Panic Alert Message
Event Time – Date and time when the event occurred.
