Vehicle Detail
Clicking an individual vehicle icon on the Insight map will open the vehicle detail view for the selected vehicle. An individual vehicle can also be accessed entering the vehicle name in the Vehicle Search text box.
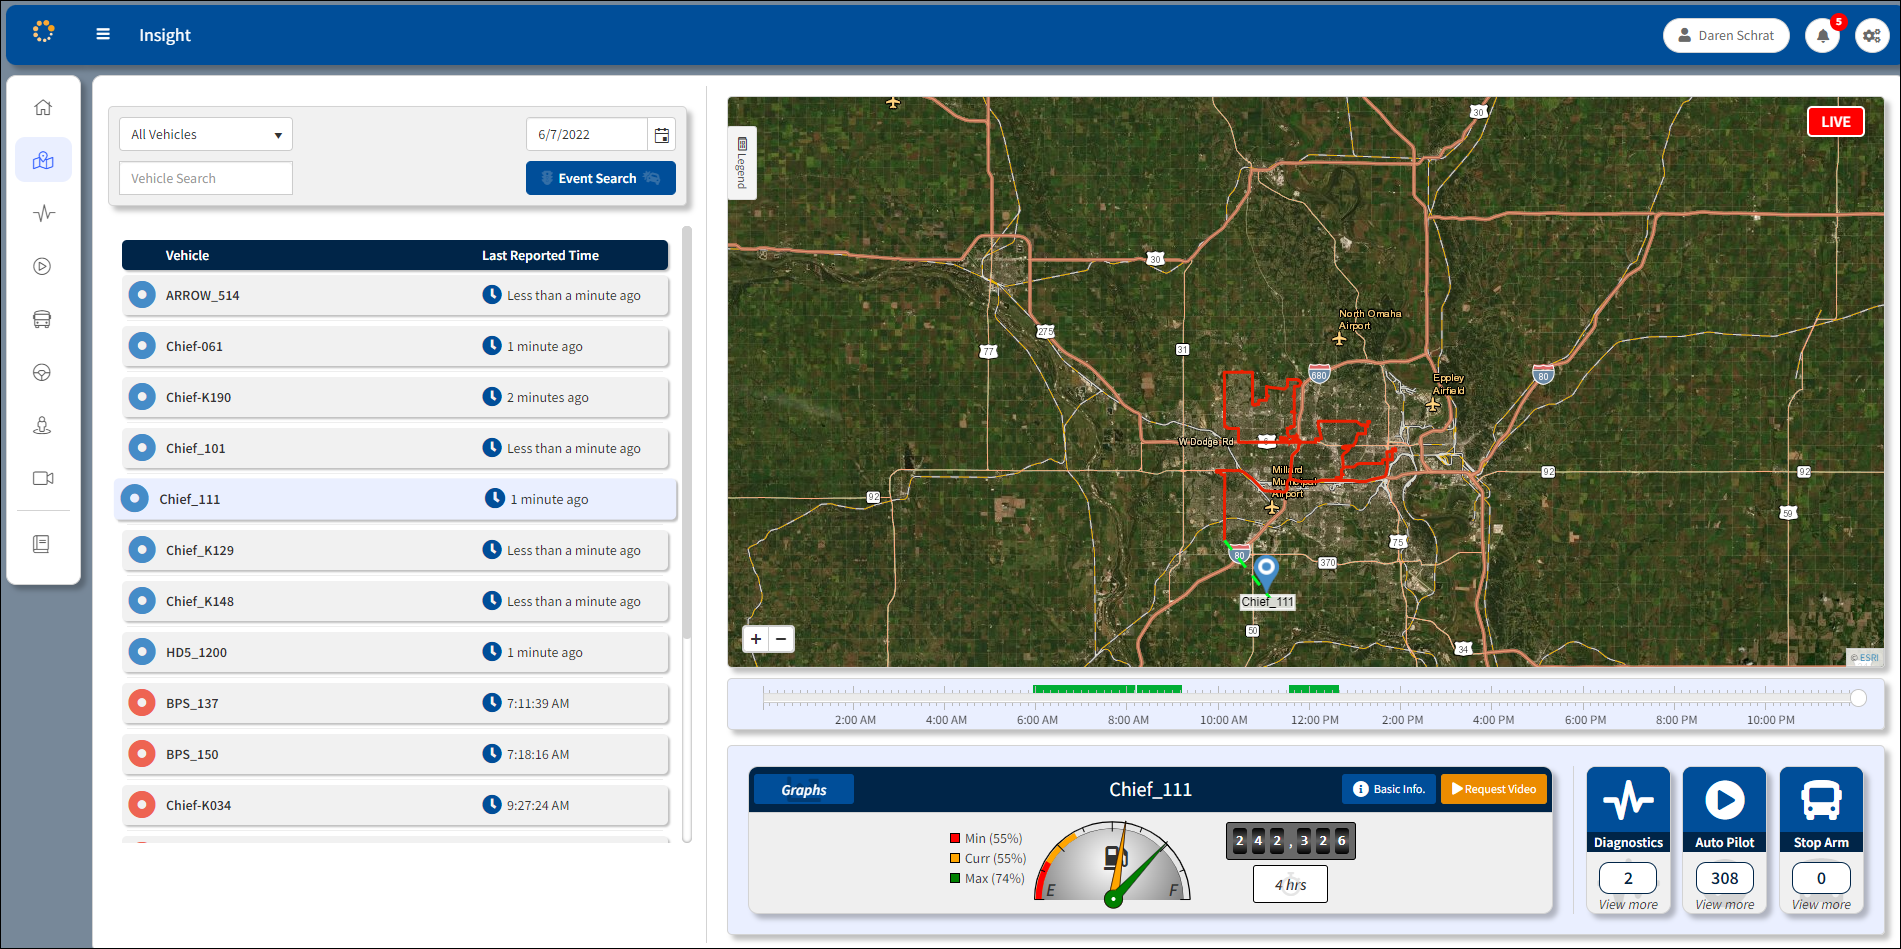
Click an individual vehicle icon to highlight the route and display details of a specified vehicle. The example on the following map depicts data for a specified vehicle (i.e., Chief_111).

Initial View For Selected Vehicle
The name of the vehicle is displayed between the Graphs button and the Request Video button. The assigned group of the vehicle, IP address of the DVR, DVR model, and when the DVR on board the vehicle last reported, is displayed on the Details panel.
Click the Basic Info button to display the Group, IP Address, Model, and Last Reported data associated with the subject vehicle.

Basic Info Display
Display J1939 Details
Click the J1939 Info button to display the vehicle information dialog box that displays J1939 data of Fuel Level, Engine Hours, and the Odometer reading.

J1939 Info Display
Fuel Level: A gauge is displayed. A Minimum, Current, and Maximum percentage of fuel is denoted in the color-keyed scale with the gauge.
Odometer: An odometer displays the current mileage of the vehicle.
Engine Hours: The number of engine hours is displayed below the odometer.
Note: If J1939 data is not reported from the vehicle, only the Basic Information is displayed.

Basic View without J1939 Info Available
Request Video
Clicking the Request Video button directs the user to the Request Video page. Refer to the Request Video section for more information.
Diagnostics data, Auto Pilot and Stop Arm events can be accessed by clicking on the buttons on the right side of the dialog box. Refer to the Vehicle Details Reporting section for more information.
Note: The Diagnostics, Auto Pilot, and Stop Arm buttons are continually displayed and are hidden when the Graphs button is selected.
One Second Location Update
For HD5 DVR-equipped vehicles, one-second location update functionality enables users to track the course of a selected vehicle as it updates its position when viewing them on the current day.
The update rate is set by the administrator on the Discovery Interval field in the DVRs dialog box of Advanced Settings.
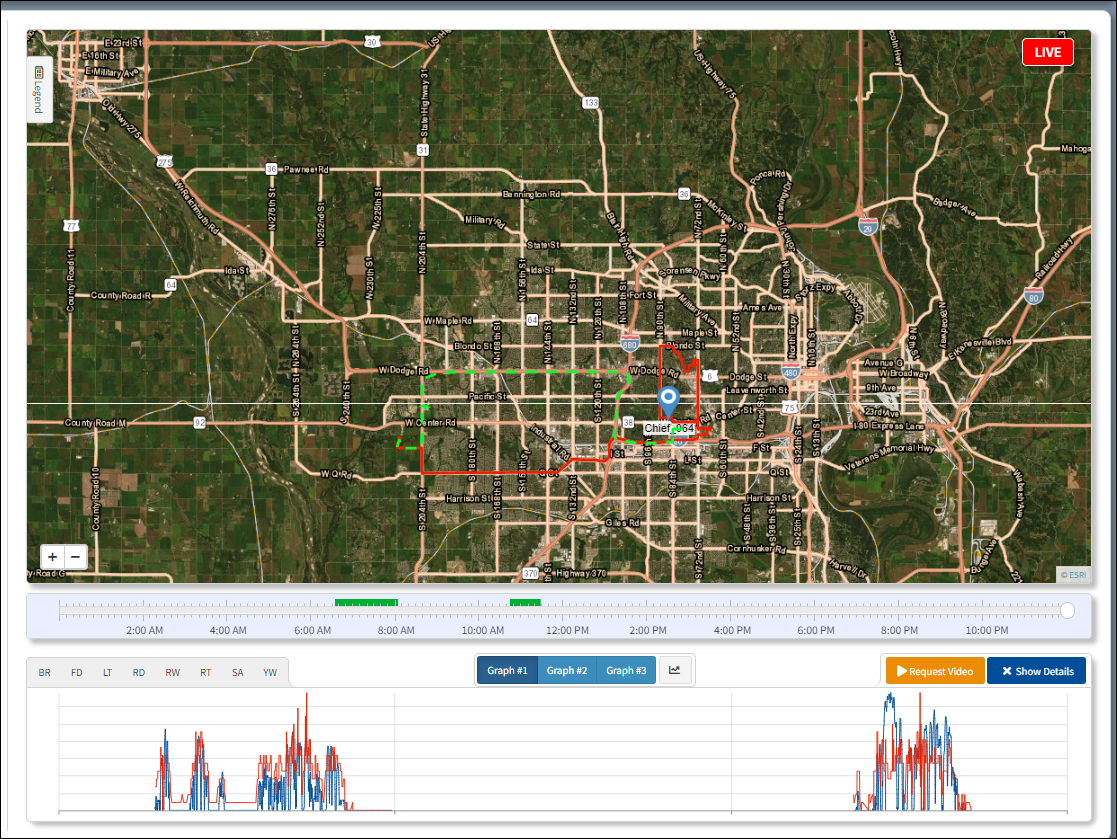
A green dotted line is represents the location data as reported second by second. The path, starting from the last known position, and the line is updated as the selected vehicle continues moving on its route. The vehicle position is continuously updated until the vehicle has completed traveling its route.

One Second Location Update
Graph Details
Click the Graphs button ![]() to switch to the graphs view.
to switch to the graphs view.
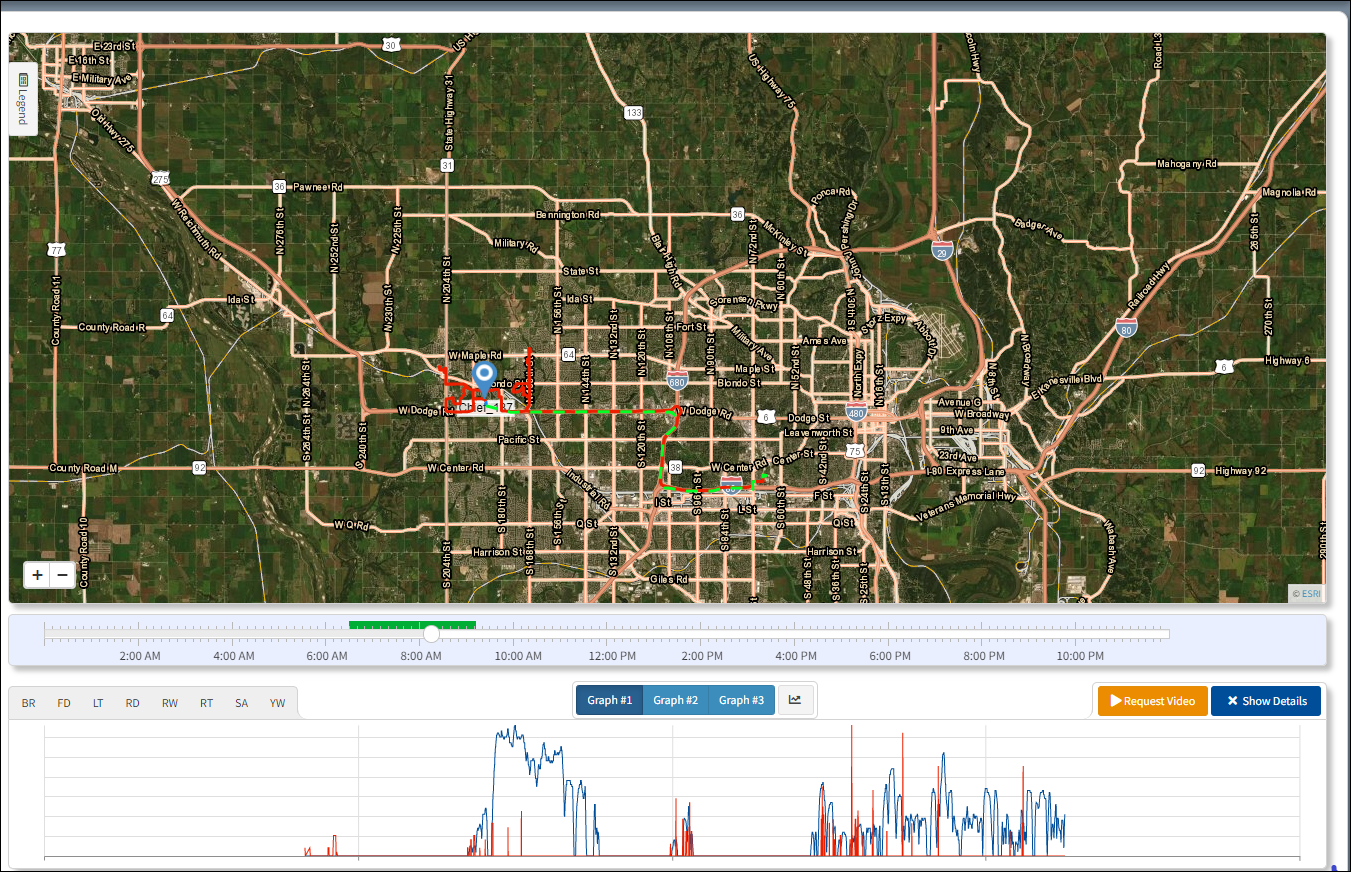
The graphs are displayed at the bottom of the window. Click the Graph #1 to Graph #3 buttons to access one of the three graphs selected in the Setup graphs menu.

Graphs View
Hover over a point of the graph to display specific information for the selected point of the graph as shown in the Speed and Accel Graph below. The Request Video function is also found within the Vehicle Details drop-down.
Note: Request Video is only available if ARMOR-AutoPilot is installed.
o Speed – Speed of the vehicle measured in miles per hour (mph) denoted by a blue line on the graph.
o Acceleration – Acceleration of the vehicle is measured in g-force (g) by a yellow line on the graph.
o Voltage – Voltage supplied to the video system or DVR.
o Hard Drive Temperature – Temperature of the hard disk drive measured in degrees Fahrenheit denoted by a red line on the graph.
o System Temperature – Temperature of the DVR system measured in degrees Fahrenheit denoted by a pink line on the graph.
Sample detail view of an individual vehicle displayed after the Individual Vehicle Icon is clicked, or a vehicle is selected from the Vehicle: drop-down list:

Speed and Accel Graph

Voltage and Hard Drive Temperature

System Temperature
Click the Show Details button to display the Basic Info view that displays the buttons that access Diagnostics, AutoPilot, and StopArm information.
Inputs
Inputs will be highlighted when an input signal is received from one of the following:
▪RW – Red Warning
▪YW – Yellow Warning
▪LT – Left Turn
▪RT – Right Turn
▪SA – StopArm
▪BR – Brakes
▪RA – Radar
▪NM – Night Mode
▪FD – Front Door
▪RD – Rear Door
▪L – Lift
▪DA – Deaccelerator
▪CUS – Custom1 thru Custom4
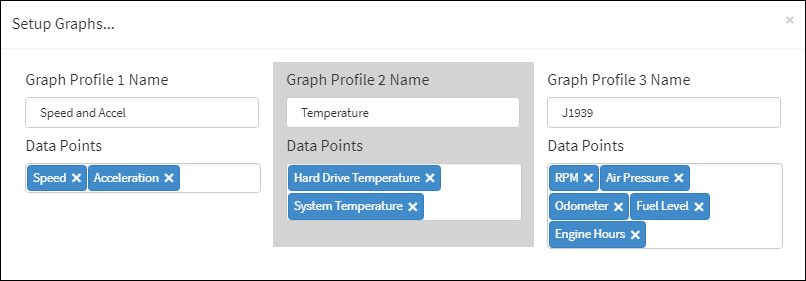
Click Setup Graphs ![]() to open the Setup Graphs Dialog box where the Graph Profiles containing selected Data Points supporting profiles such as Speed and Accel, Temperature, and J1939 vehicle details can be configured.
to open the Setup Graphs Dialog box where the Graph Profiles containing selected Data Points supporting profiles such as Speed and Accel, Temperature, and J1939 vehicle details can be configured.

Setup Graphs Dialog Box
Click the Show Details button ![]() to revert to the initial display.
to revert to the initial display.
